Data is at the core of many decisions that organisations make. Good data helps organisations optimise production processes, improve product quality, enhance supply chain management and, ultimately, drive better decision making. Rich sources of aggregated data help organisations gain better insights across operations — from customers and production processes to finance and logistics.
A key struggle is consolidating and aggregating data sources. Most organisations process data across a variety of systems. Due to the disparate nature of these systems, providing access to data can be challenging.
Another major challenge is ensuring the timely flow of clean, accurate data. Delays of latency in data movement can mean that insights are based on outdated information. Data quality issues like inaccuracy, duplication and inconsistency can hinder the effectiveness of insights.
Latency in data availability also limits the ability to respond quickly to problems. Manual data wrangling processes fail to keep pace with speeds of modern production, so leveraging data warehousing tools like Snowflake are important in ensuring access to well-structured data.
As the volume of data continues to grow, these challenges will only intensify. But overcoming them can drive better insights and decision making. Developing strong data management foundations and analytics capabilities is key for organisations to thrive in the future.
Before your organisation begins aggregating and transforming data, it is first useful to consider 3 preliminary steps involved in planning these data projects:
1. Where should you put your data?
2. What processes should sit over your data?
3. How will you visualise your data?
1 - Where should you put your data?
Determining the optimal architecture to store and organise data is a crucial first step for organisations. By assessing current data volumes, variety and velocity, organisations can identify the infrastructure needed to meet processing and storage needs.
While a relational database may suffice for highly transactional data from systems, if your organisation is dealing with large volumes of unstructured and multi-structured data from various sources, then a data lake or data warehouse can be advantageous. In cases where organisations might need to store both raw and processed data, data lakehouses are also beneficial. Below is a breakdown of these different storage options:
| Data Lake | Data Warehouse | Data Lakehouse | |
|---|---|---|---|
| What? | A large repository that stores raw, unstructured data in its native format. | A structured repository that is optimised for querying and analysis | Combines the capabilities of data lakes and data warehouses. |
| How? | Does not transform or process data. Instead, it stores vast amounts of raw data until it is needed for further analytics and visualisation. | Data is cleaned, processed and modelled so that it is optimised for querying and analysis. | Stores both raw and processed data to enable organisations to perform rapid analytics on massive datasets while also persisting the raw data for future reprocessing as needs change. |
| When? | Storing clickstream data, sensor data, social media data for future machine learning and advanced analytics. | Generating reports, dashboards and analytics on areas like sales, marketing and operations. | You need to analyse raw data on-the-fly but also want performance of structured data. |
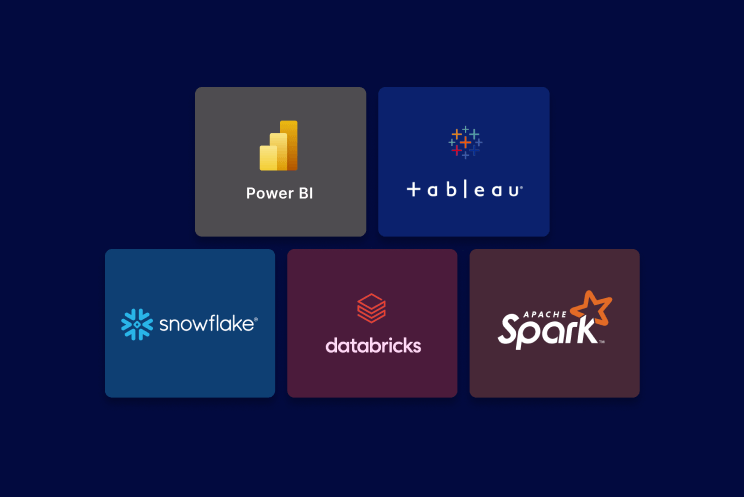
| Technologies | Snowflake, Apache Spark | Snowflake, Databricks | Databricks, Apache Spark |

2 - What processes should sit over your data?
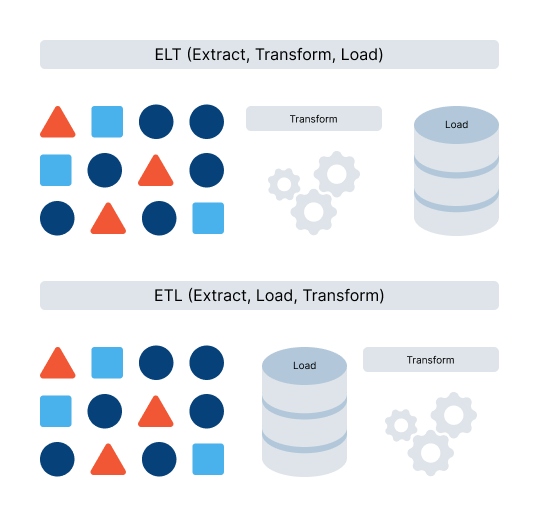
Once quality data is aggregated, organisations need to implement robust processes to govern its use and provide oversight. A key first step is establishing data ingestion protocols that map data sources and cleanse, validate and integrate the data through ETL (Extract, Transform, Load) or ELT pipelines (Extract, Load, Transform).
With quality data ingestion in place, ongoing monitoring should provide insights into data health KPIs like accuracy and completeness over time. Metadata catalogues are crucial for centrally recording definitions, business context and lineage. Master data management creates unified master datasets for products, suppliers, equipment and more.
Additionally, data quality rules and algorithms help detect anomalies, while comprehensive security and compliance policies are essential for protecting and governing data usage and integrity. With the right processes governing aggregated quality data, organisations can feel secure getting the insights needed to optimise operations.

3 - How will you visualise your data?
A question to ask your organisation here is “what does 'good' look like?”
- What are the key metrics and KPIs that reflect performance and health across operations?
- What insights are needed to guide decisions around improving quality, efficiency, throughput and more?
- If you're going into a boardroom, what strategic questions would you like to be able to answer from your data?
Defining these needs and aligning visualisations to critical business objectives is key to a successful data project.
Connect transformed datasets to analytics and visualisation tools like Power BI or Tableau. Build interactive dashboards to surface key findings and insights. Ensure accessibility across the organisation.
Enabling self-service access and updates allows cross-functional sharing of reports. Production monitoring integrates real-time sensor data alongside historical trends analysed using ML predictive analytics. With the right data foundation, processes, and reporting approach in place, organisations can gain a substantial competitive advantage.
Dealing with this big data is an inherently complex challenge, so taking some time to first answer these questions can give your project some direction and ensure that you’re getting the most valuable insights.


